

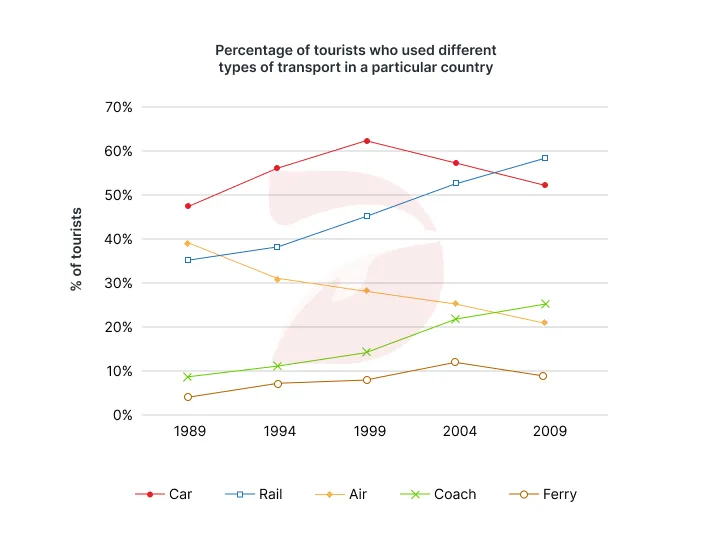
The percentages of tourists who used different types of transport to travel within a particular nation
Đề thi IELTS Writing Task 1 ngày 16/12/2023 dạng Line Graph: The graph below shows the percentages of tourists who used different types of transport to travel within a particular nation between 1989 and 2009. Each tourist may have used more than one type of transport.

🚀 Đề bài
😵 Dàn ý
DOL sẽ miêu tả biểu đồ với 1 câu mở bài (Intro), 1 đoạn miêu tả tổng quát (Overview), và 2 đoạn thân bài miêu tả chi tiết (Detailed Description)
Mở bài: DOL sẽ paraphrase đề bài để giới thiệu lại đề bài cho người chấm.
Miêu tả tổng quát: DOL sẽ chỉ ra các đặc điểm quan trọng, nổi bật nhất trong biểu đồ.
Thân bài:
Body 1: DOL mô tả phần trăm số lượng khách du lịch sử dụng các loại phương tiện khác nhau năm 1989.
Body 2: DOL mô tả xu hướng đến năm 2009
📚 Vocabulary


✨ Bài tập Exercise
Exercise 1:
surged to
respective
dropped considerably
witnessed an upward trend
took the leading position
Exercise 2:
Điền từ vào chỗ trống (dựa vào những gợi ý có sẳn)
Tổng hợp đề hay tháng 12.2023 có bài mẫu tham khảo.
💡 Lời kết
 Sau sample The graph below shows the percentages of tourists who used different types of transport to travel within a particular nation between 1989 and 2009. Each tourist may have used more than one type of transport, DOL mong các bạn không chỉ nắm được cách trả lời cho dạng bài Line graph, mà còn học được những từ vựng và cấu trúc hay để miêu tả các biểu đồ tương tự nhé.
Ví dụ: The given line graph illustrates how travelers commuted in a country over a 20-year period.
Ví dụ: Five modes of transportation including car, rail, airplane, coach and ferry were surveyed with percent as the unit of measurement.
Ví dụ: nearly half of tourists traveled around the country by car, establishing it as the most prevalent vehicle.
- Dùng công cụ preferencing "this".
Ví dụ: Nearly half of tourists traveled around the country by car, establishing it as the most prevalent vehicle. This was followed by airway and rail lines
- Meanwhile: trong khi đó -> dùng để mô tả 2 số liệu ở cùng một thời điểm.
- Thereafter: sau đó -> dùng khi bạn đưa ra số liệu ở những năm tiếp theo.
- Opposite changes can be seen in + N: những thay đổi ngược lại có thể được thấy ở -> dùng khi muốn đưa ra những xu hướng trái ngược với những xu hướng bạn đã đề cập trước đó.

Bài viết khác
[Quý 2/2026] Đề thi thật IELTS Writing Task 1 – Dạng Line graph, chủ đề Train Performance kèm bài mẫu band 8.5+, dàn ý chi tiết, từ vựng và bài tập ôn luyện.
[Quý 2/2026] Đề thi thật IELTS Writing Task 1 – Dạng Map, chủ đề Museum Redevelopment kèm bài mẫu band 8.5+, dàn ý chi tiết, từ vựng và bài tập ôn luyện.
[Quý 2/2026] Đề thi thật IELTS Writing Task 1 – Dạng Map, chủ đề Building's Ground kèm bài mẫu band 8.5+, dàn ý chi tiết, từ vựng và bài tập ôn luyện.
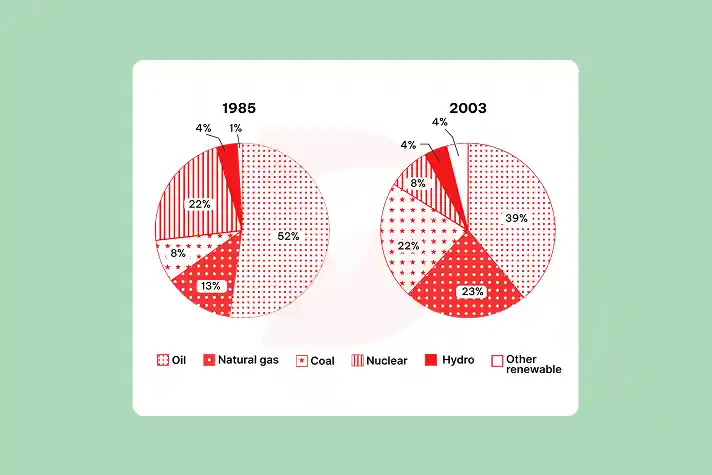
[Quý 2/2026] Đề thi thật IELTS Writing Task 1 – Dạng Pie chart, chủ đề Energy Production kèm bài mẫu band 8.5+, dàn ý chi tiết, từ vựng và bài tập ôn luyện.
[Quý 2/2026] Đề thi thật IELTS Writing Task 1 – Dạng Pie Chart, chủ đề The use of public libraries kèm bài mẫu band 8.5+, dàn ý chi tiết, từ vựng và bài tập ôn luyện.