

Bài mẫu IELTS Writing Task 1 band 8 ngày 07/11/2024
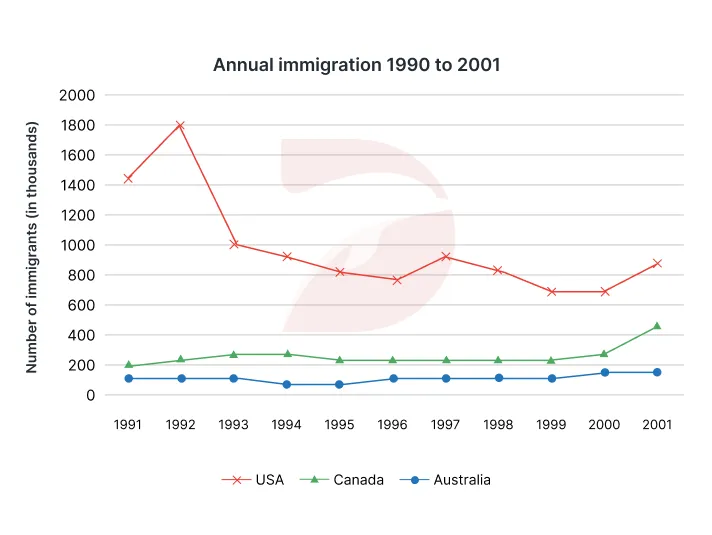
Đề thi IELTS Writing Task 1 ngày 07/11/2024 dạng Line graph: The graph below shows the number of immigrants to three countries from 1990 to 2001. Summarize the information by selecting and reporting the main features, and make comparisons where relevant.

🚀 Đề bài
😵 Dàn ý
📚 Vocabulary


✨ Bài tập Exercise
Exercise 1: Điền từ / cụm từ phù hợp để hoàn thành câu sau.
experienced a sharp decline
remained relatively stable
Immigration
has seen an increase
consistently
Exercise 2: Tìm những từ / cụm từ tiếng Anh phù hợp với những từ / cụm từ sau.
💡 Lời kết
Tới đây là hết rồi 😍 Sau sample “The graph below shows the number of immigrants to three countries from 1990 to 2001. Summarize the information by selecting and reporting the main features, and make comparisons where relevant.", DOL mong các bạn không chỉ nắm được cách trả lời cho dạng bài Line graph, mà còn học được những từ vựng và cấu trúc hay để miêu tả các biểu đồ tương tự nhé.
🤩 Mình cùng nhau học lại những cấu trúc hay đươc dùng trong bài nhé!
Ví dụ: The chart shows that the USA experienced a sharp decline in annual immigration, while Canada saw an increase.
Ví dụ: Despite significant decreases, the USA consistently had the highest number of immigrants.
Ví dụ: Annual immigration to the USA dropped sharply to about 800 thousand, then fluctuated slightly [...]. In contrast, immigration to Canada and Australia remained relatively stable throughout the entire given period.
Ví dụ: Immigration to Canada and Australia remained relatively stable throughout the entire given period, [...]. By the final year, however, Canada experienced a sharp increase, reaching 400 thousand immigrants.
Ví dụ: Annual immigration to the USA dropped sharply to about 800 thousand, then fluctuated slightly between 1996 and 2001, finishing the period at around 900 thousand immigrants, still ranking first.
=> Việc sử dụng các từ như "then" (sau đó), "between 1996 and 2001" (giữa 1996 và 2001), và "finishing" (kết thúc) giúp tạo ra một mạch thời gian liên tục và kết nối chặt chẽ giữa các sự kiện => từ đó làm rõ sự biến động của số liệu qua từng giai đoạn.
Nếu có thời gian thì nhớ làm phần bài tập và tự mình viết một bài khác nha vì 'Practice makes perfect' mà nhỉ? DOL chúc các bạn học tốt! 🥳
Bài viết khác
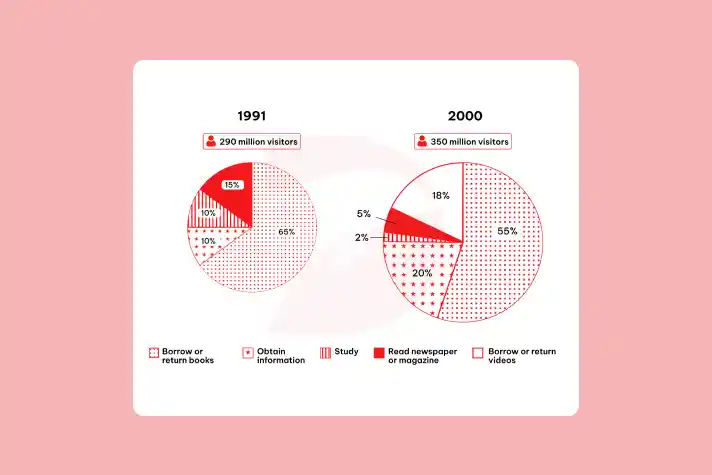
[Quý 2/2026] Đề thi thật IELTS Writing Task 1 – Dạng Pie Chart, chủ đề The use of public libraries kèm bài mẫu band 8.5+, dàn ý chi tiết, từ vựng và bài tập ôn luyện.
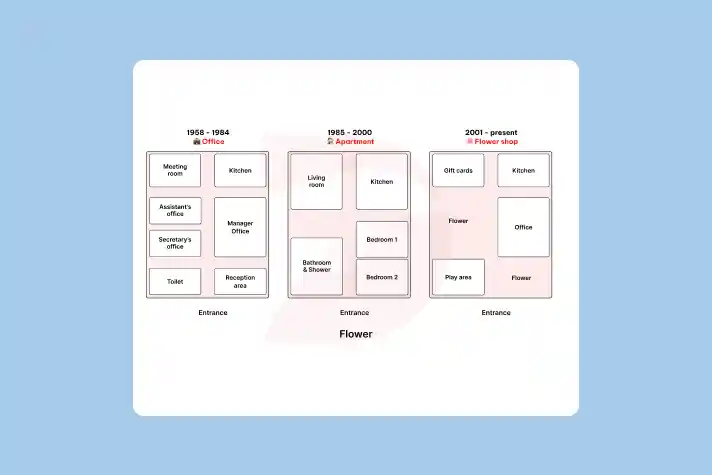
[Quý 2/2026] Đề thi thật IELTS Writing Task 1 – Dạng Map, chủ đề Building's Ground kèm bài mẫu band 8.5+, dàn ý chi tiết, từ vựng và bài tập ôn luyện.
[Quý 2/2026] Đề thi thật IELTS Writing Task 1 – Dạng Map, chủ đề Spending on health kèm bài mẫu band 8.5+, dàn ý chi tiết, từ vựng và bài tập ôn luyện.
[Quý 2/2026] Đề thi thật IELTS Writing Task 1 – Dạng Map, chủ đề Museum Redevelopment kèm bài mẫu band 8.5+, dàn ý chi tiết, từ vựng và bài tập ôn luyện.
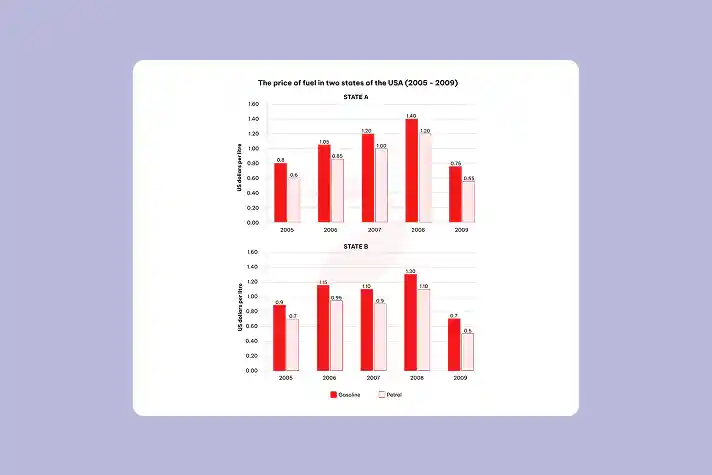
[Quý 2/2026] Đề thi thật IELTS Writing Task 1 – Dạng Bar charts, chủ đề Fuel Prices kèm bài mẫu band 8.5+, dàn ý chi tiết, từ vựng và bài tập ôn luyện.